
Platform
Three capabilities on one measurement basis. Advanced sensors feed a single system that turns readings into decisions you can still act on.
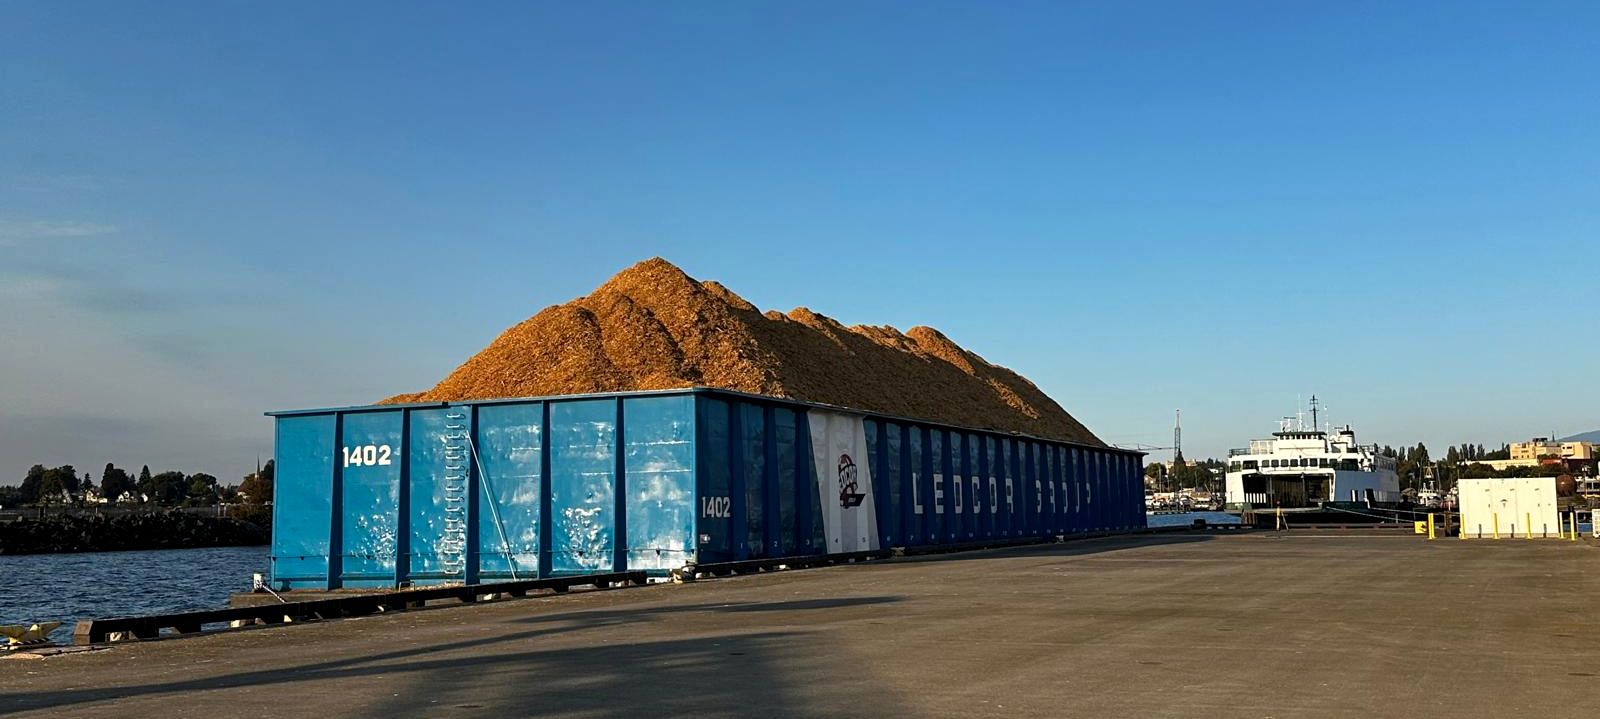
See the barge fill,
while it is filling
A LiDAR head over the hold measures the cargo surface continuously as the barge loads — roughly 90,000 returns per scan, measured down to the hold floor. Volume comes from the surface that is actually there, not from an assumed shape.
- Live fill percentage on screen throughout the load
- Top off to target before the barge sails, instead of finding out afterwards
- Settlement runs on the measured figure, automatically
- Works across any bulk material — a measured surface is a measured surface
The whole fleet, on one screen
Where every barge is, what is on it, how full it is, when it will berth — and what it is costing you while it waits. Click any barge to open its detail.
Illustrative demo. Barge identifiers, cargoes and inventories are simulated; port geography is real.
Laytime before it bites
Every barge carries a laytime clock. See which are approaching their limit and re-sequence the berth queue while it still changes the outcome.
Position, even without AIS
Where a tow carries no transponder, position is dead reckoned from the last known fix, speed and route — and marked as estimated, not silently guessed.
Days of supply, projected
Inventory, consumption rate and the inbound fleet are modelled together, so a shortfall shows up days out — not on the morning the yard runs dry.
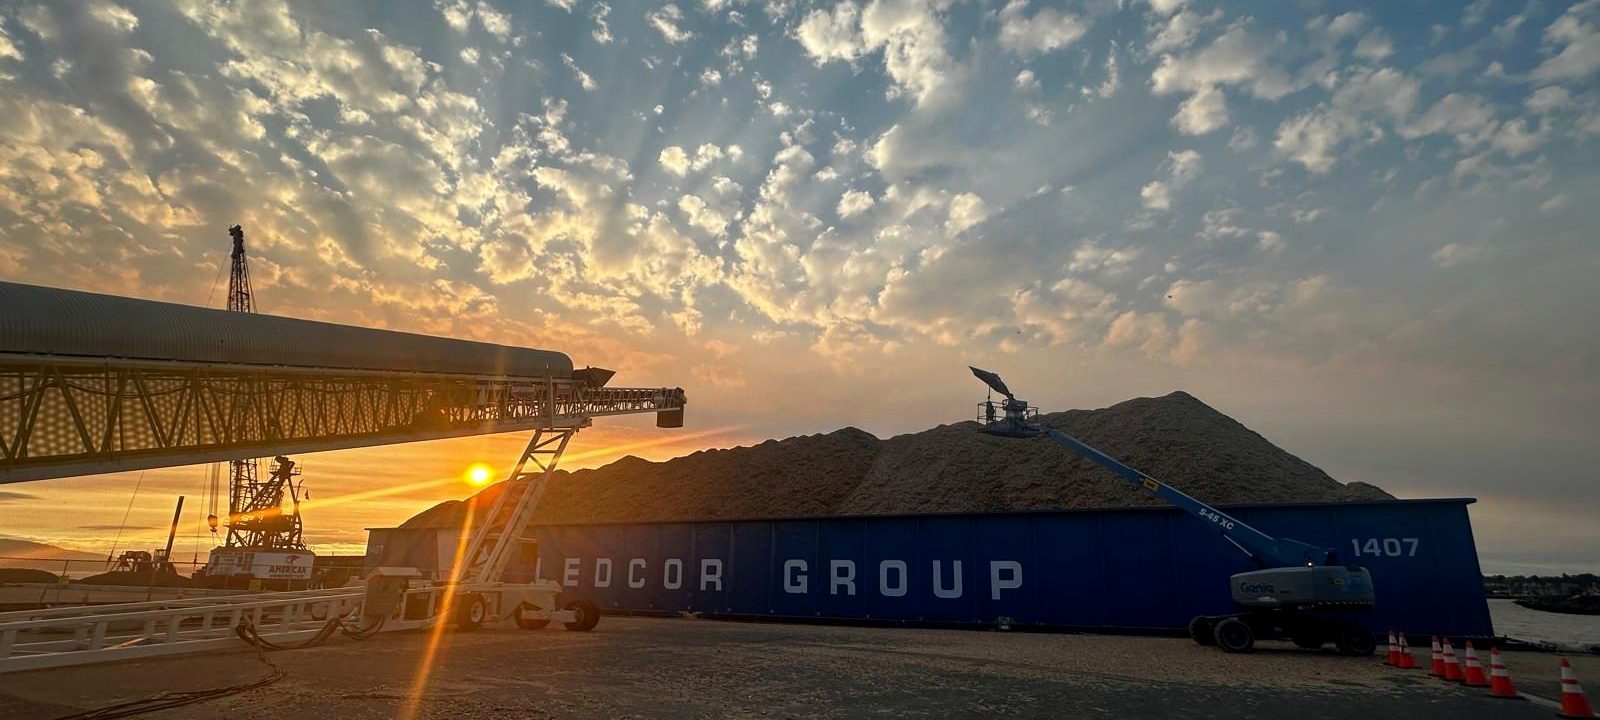
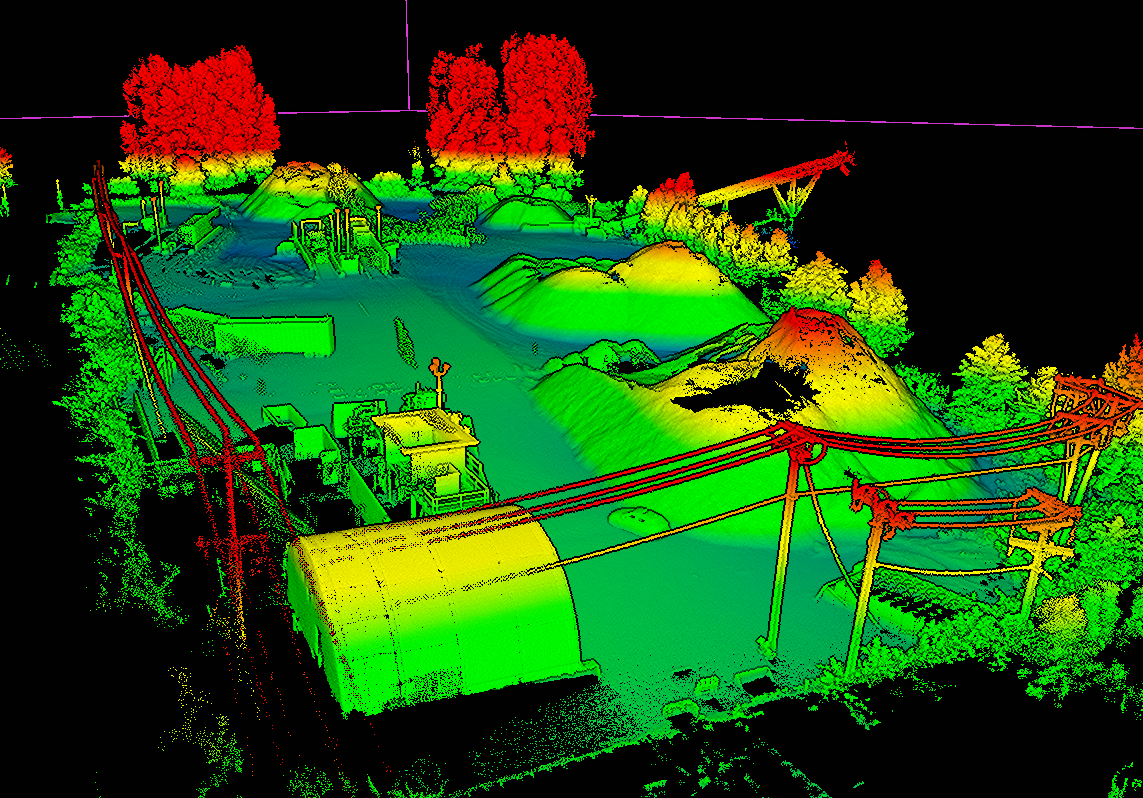
Your yard as live inventory
A stockpile survey is a snapshot that starts going stale the moment it is taken. Volumetric scanning measures continuously, so tonnes on the ground is a number you can act on rather than reconcile later.
- Volume from the measured surface, not an assumed cone
- Tonnage derived per material using its own density
- Days of supply projected against draw-down and inbound deliveries
- No shutdown, no survey crew walking the pile
Illustrative figures.
See it running on your operation
A scoped pilot on one berth or one yard, measured against figures you already trust.